All projects

Syrian Maps / 2024

A city.
A thousand ways
through.

Find your way through Damascus.

Or scroll to explore
Assembling the streets…
01 — A CITY, CONNECTED© OpenStreetMap contributors
At a glance

What this work solves.

Geospatial products, route planning, data-rich interfaces, and custom visual tools.

Problem
Turn geographic data and road relationships into a map people can search, edit, and route through.
My contribution
Designed and built the mapping interface, Canvas rendering, route-finding behavior, and offline-region workflow.
Result
A working map system that combines geographic data, route planning, editing, and offline use.
Behind the experience / 2024

A way through the city.
A system behind every turn.

Syrian Maps brings geographic data, route finding and map-management tools together. The experience above lets you explore a small part of that system.

Built from the original ideas.

This interactive experience uses simplified versions of the algorithms developed for Syrian Maps (2024). It recreates selected features on a smaller dataset to demonstrate how the original project works.

This recreation uses React, TypeScript and Three.js, with a compact in-memory street graph. The original system used database-backed map blocks and a Canvas 2D dashboard. Building heights here are illustrative; the footprints follow the archived map.

The original dashboard

Where the map was made.

The archived dashboard with the project’s own Damascus map files imported.
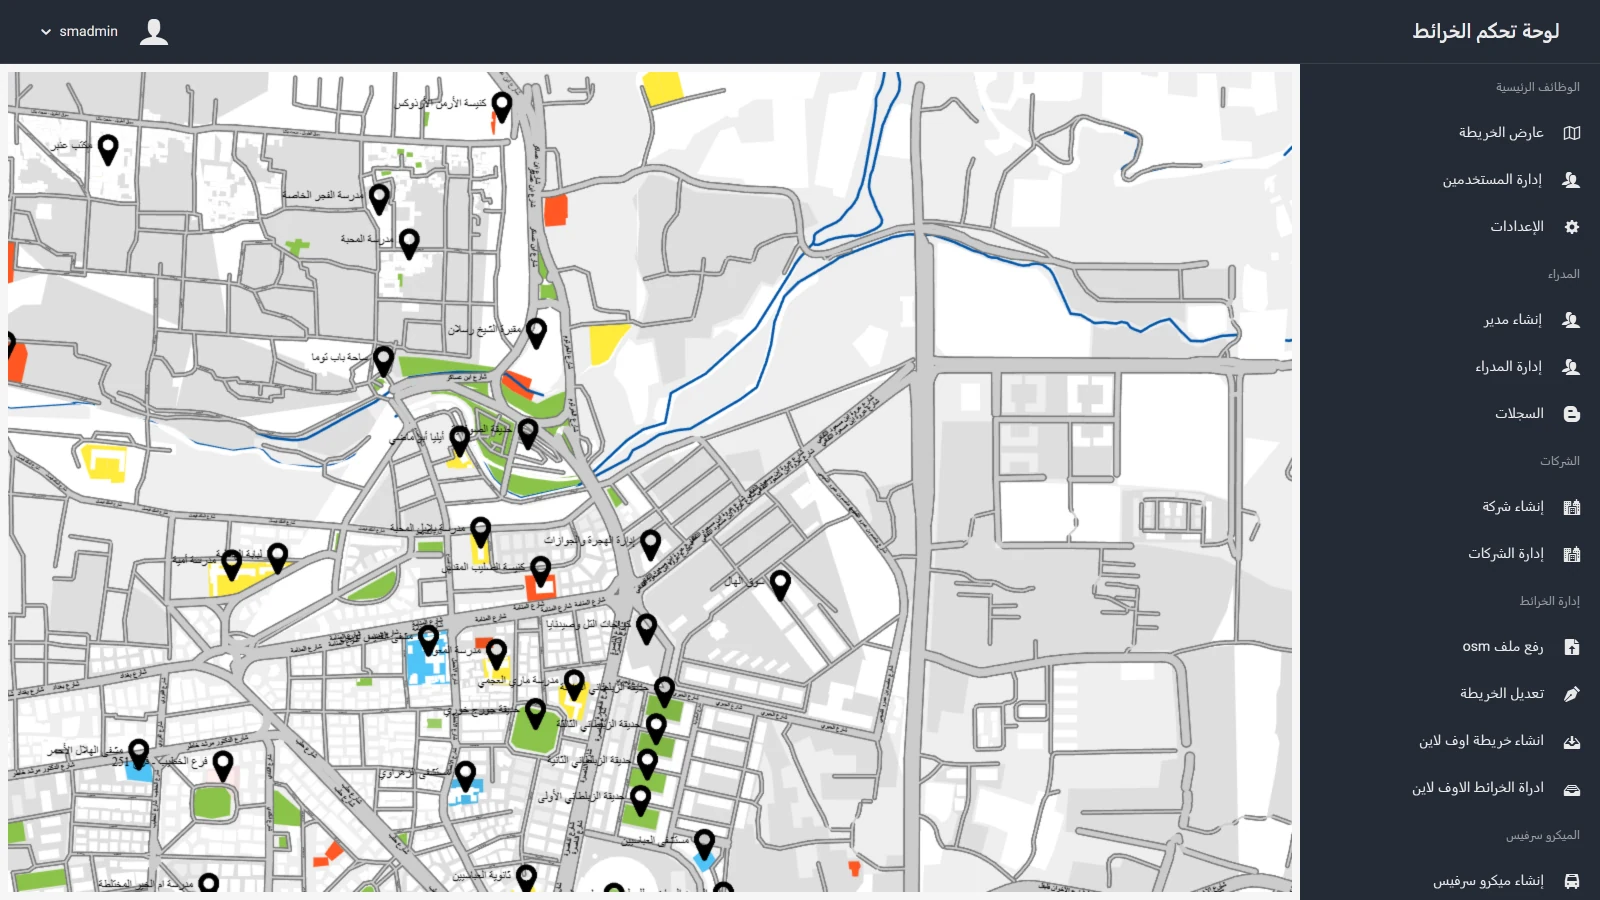
The map dashboard in the Syrian Maps dashboard
The map dashboardThe dashboard home: one canvas for the whole map. Streets and building footprints are drawn from imported OpenStreetMap data, areas keep their own colours — parks, schools, hospitals, water — and places carry their Arabic names. Map blocks load from the database as the viewport moves.

Captured from the Express, MongoDB and Canvas 2D dashboard in the original repository, filled with its archived OSM files. The experience at the top of this page is a browser recreation of the same ideas.

The full picture

One project. Many moving parts.

From route finding to the tools that keep a map useful.

01

A map engine of its own

Explore it here
  • Import OpenStreetMap XML: nodes, ways, areas, relations and geographic bounds.
  • Read region-based map blocks, road metadata and places, including names, descriptions and images.
  • Convert longitude and latitude into projected map coordinates with Proj4.
  • Use spatial grids, multiple detail levels and asynchronous viewport loading to organize map data.
  • Draw streets, areas, labels, markers and routes with a custom Canvas 2D renderer; pan and zoom the map.
02

More than one way there

Walking + driving demo
  • Walking routes and driving routes with road-direction constraints.
  • Cost-and-heuristic pathfinding with a priority queue, nearest-node and nearest-edge lookup.
  • Distance and travel-time estimates using configured walking and road-type speeds.
  • Alternative-route requests that give a lower preference to an earlier route.
  • Local public-transport route search combining walking legs with microbus/service routes.
  • Transport route names, descriptions and prices, plus configurable walking thresholds.
03

Tools to build the map

Original dashboard
  • Create and edit nodes, edges and polygon areas directly on a map.
  • Modify geometry and map metadata, save map-block updates and upload place images.
  • Create, search and remove local transport routes.
  • Preview and debug walking, car and public-transport routing through dashboard tools.
04

Take a region with you

Original offline workflow
  • Choose geographic bounds and generate a downloadable JSON map package.
  • List, search, activate, deactivate and delete offline regions.
  • Allow authenticated clients to download active map packages.

Try the idea with this experience’s compact, openly licensed map extract. The file contains geometry and routing data, not an offline application.

05

Access for people and apps

Original backend
  • User registration and email/password login, with phone-number profile data.
  • Guest access through temporary tokens, plus administrator login and logout.
  • JWT authentication, password hashing and dashboard sessions/cookies.
  • Company/application credentials and permission checks on protected operations.
  • Account verification, deletion, blocking and unblocking; a location-registration endpoint.
  • OTP verification and an email-delivery hook were prepared; automatic verification email was not enabled.
06

A working management layer

Original dashboard
  • Search and paginate users, administrators, companies, transport routes and offline maps.
  • Create and delete administrator and company records.
  • Record and inspect request/response logs.
  • Edit global map and routing settings, including speed and walking-distance parameters.
  • Process supervision and rotating logs using PM2 tooling.
The original toolkit

What made it work.

Production code, supporting tools and experiments, with their roles made clear.

Application & data

TypeScriptNode.jsExpressMongoDBMongoose

A typed HTTP backend with geographic map blocks, application models and a MongoDB 2dsphere index.

Maps & geometry

OpenStreetMapXML / xml2jsProj4Canvas 2D

OSM ingestion, coordinate transformations, a custom map renderer, spatial indexing and graph traversal.

Dashboard

EJSHTML & CSSBootstrapjQuery

Server-rendered dashboard pages and browser tools for map editing, route previews and administration.

Access & uploads

JSON Web TokensbcryptSessions & cookiesMulterNodemailer

Authentication, password hashing, persistent dashboard sessions, uploads and an email-verification hook.

Build & operations

WebpackTypeScript compilernpmPM2Log rotationPostman

Browser bundles, server compilation, process management, log tooling and a supplied API request collection.

Interface experiments

Dart / FlutterReactCanvas & shaders

Early interface studies explored Flutter, React and polygon rendering alongside the core system. These experiments are separate from the production backend and dashboard.

For the curious

See it with a developer’s eye.

Enable Developer mode anywhere in this portfolio to inspect real draw calls, primitives and GPU resources. Switch to wireframe to see the geometry underneath the surface.

In this experience, roads and search traces are line geometry; building surfaces reveal their triangles. Statistics update from the active renderer’s last frame.

Have a similarly specialized problem?

Let’s make the difficult part visible and usable.

Discuss a project Browse all work